← All applications
Case studyTools
Fiumi Puliti
Know How Clean Your River Is
A citizen-science map of river water quality in Italy. Explore over 1,800 monitoring sites, follow each parameter over time and add your own measurements and pollution reports.
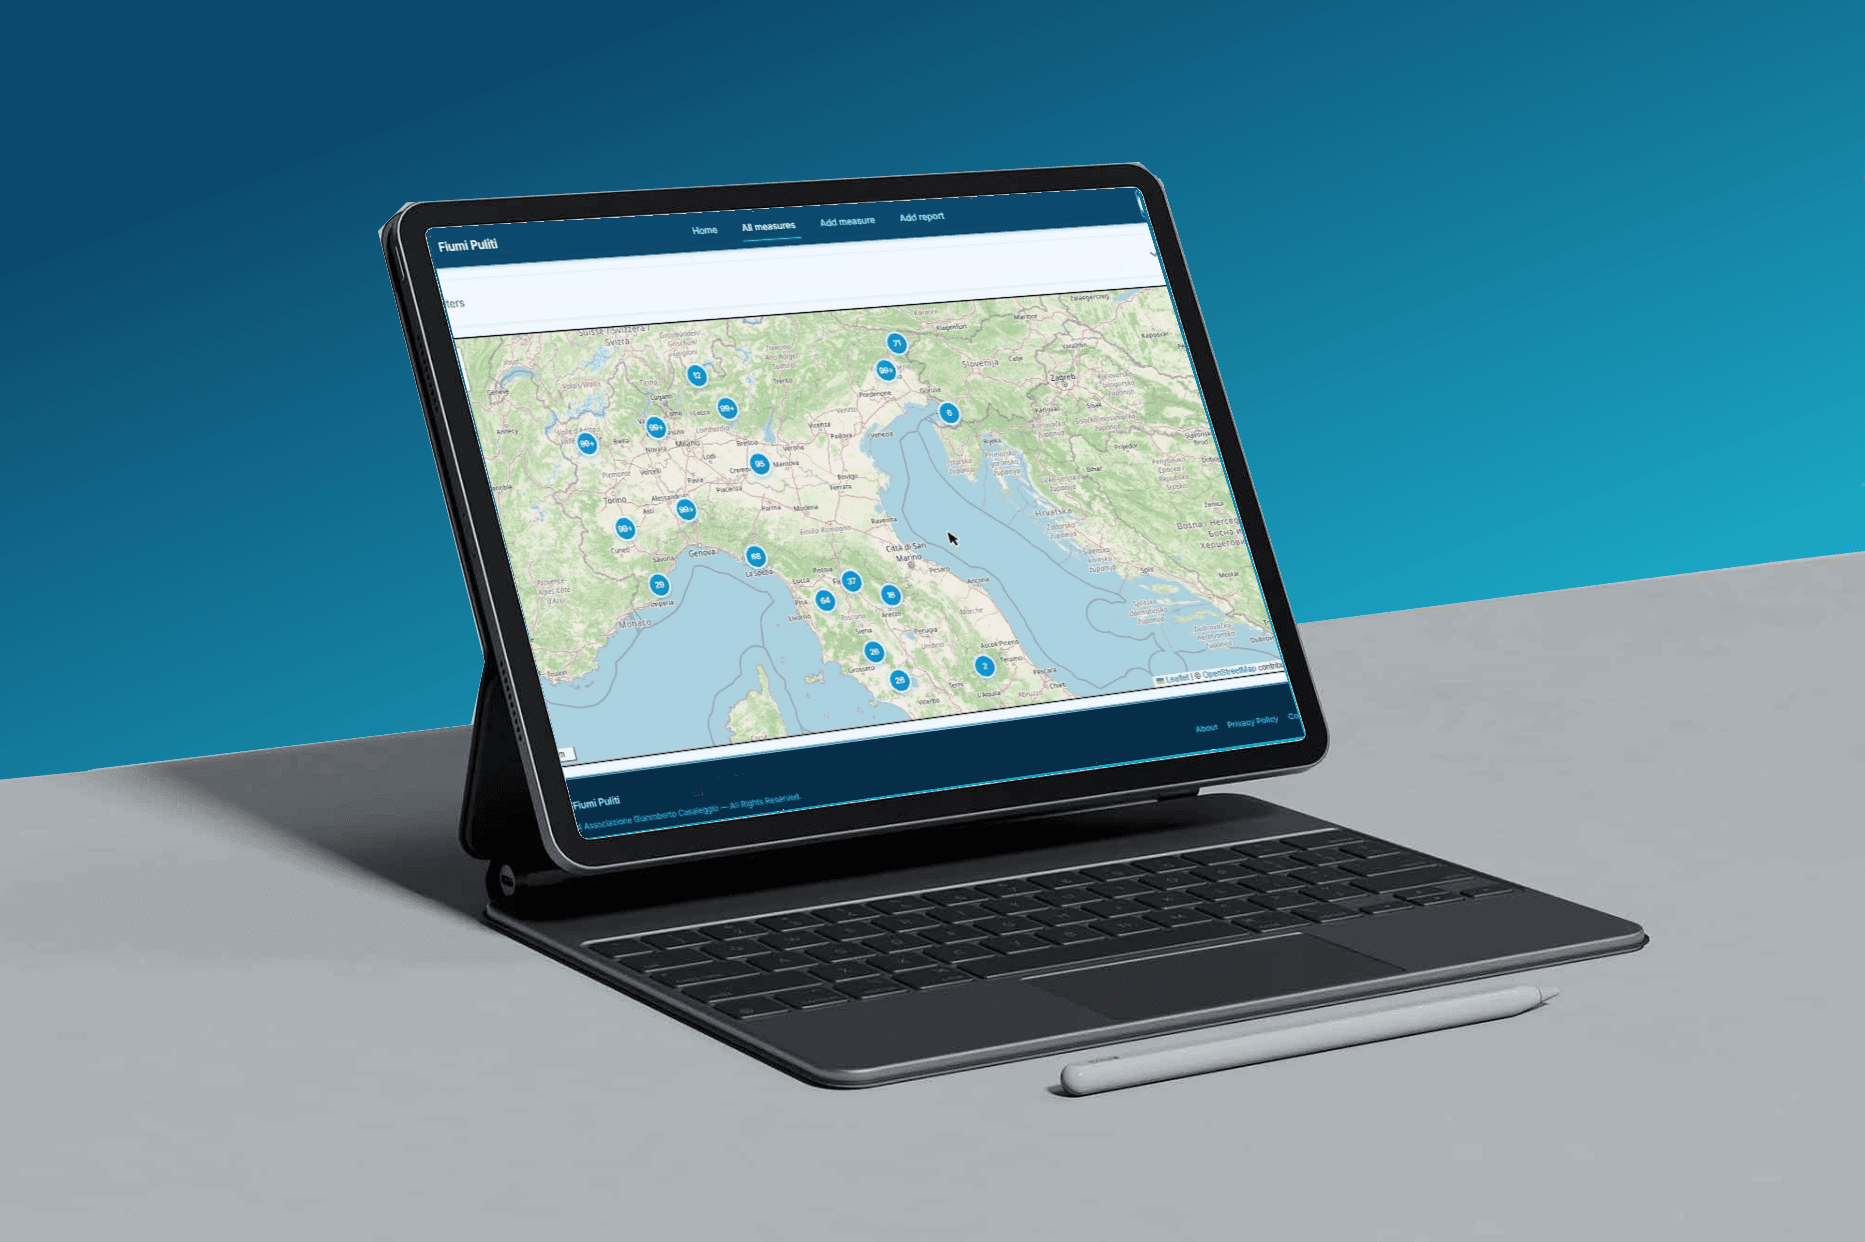
Screenshots
The problem
Data on river quality is scattered across regional agencies and hard to read, so citizens have no simple way to see how clean their local river really is.
What it does
- Interactive map of over 1,800 monitoring sites with clustering and filters
- Per-site charts of pH, nitrates, phosphates, E. coli, dissolved oxygen, temperature and the LIMeco index
- Measurements and pollution reports added by citizens, with photo and location
Technical highlights
One map for every river
Over 1,800 monitoring sites on a clustered map, filterable by date, search and ownership.
Official data, made readable
Regional ARPA datasets are imported and shown as per-site charts against the recommended thresholds.
Citizens contribute
Anyone with an account can add their own measurements or report illegal dumping with a photo and a location.
Interested in working together?
I'm open to new opportunities. Let's talk about how I can help your team.
Get in touch